Are you tired of text-heavy research papers? Try Online Drawing Tools for Thesis to add visuals.
Thesis writing is an endeavor marinated in hours of research, analysis, and hard work. To unravel your scholarly discoveries and stitch them together into a tapestry of meaningful content is a labor of love.
Yet, as we voyage through this narrative realm, a persistent difficulty emerges: How can we illuminate our text-heavy documents? How can we, as academic explorers, illustrate our ideas and findings in a manner that’s both clear and captivating?
The answer lies in the blend of technology and creativity – a suite of online drawing tools designed to accentuate your academic narratives with striking visual elements.
Table of Contents
Overview
These online marvels offer more than just drawing capabilities. They are the bridges connecting the islands of your thoughts, enabling you to draw powerful scientific diagrams and evocative illustrations.
Now, let’s embark on a voyage through this riveting world of online drawing tools, each one a unique gem in the academic treasure chest, ready to be explored and utilized to its full potential.
From the user-friendly charm of Canva to the collaborative prowess of Lucidchart, this expedition promises to be an enlightening and exciting adventure. So, sit back, buckle up, and get ready to explore these tools to create scientific illustrations for your thesis.
Online Drawing Tools for Thesis
#1. Canva: Best for Simple Infographics and Illustrations
Summary
- User-friendly interface
- Extensive library of templates and elements
- Ideal for creating infographics and simple illustrations
Canva, with its simple drag-and-drop interface, is a haven for anyone looking to add a sprinkle of visual flair to their thesis. Whether it’s a minimalist infographic or a vibrant illustration, this scientific illustration software delivers.
What are the benefits of Canva?
- Quick learning curve: No steep learning curve here, perfect for busy academics.
- Versatile: It’s like a Swiss army knife, with tools for creating a multitude of graphics.
- Quality designs: Despite its simplicity, Canva doesn’t skimp on the quality of its output.
If you’re after a versatile, easy-to-use tool that delivers quality graphics, Canva should be your go-to.
How much does it cost?
- Free
- Pro: $6.49 per month
- Teams: $8.49 per month
Source: https://www.canva.com
#2. Microsoft Visio: Best for Complex Flowcharts and Diagrams
Summary
- Industry-standard tool for creating diagrams
- Offers a plethora of customizable templates
- Exceptional at creating detailed flowcharts and diagrams
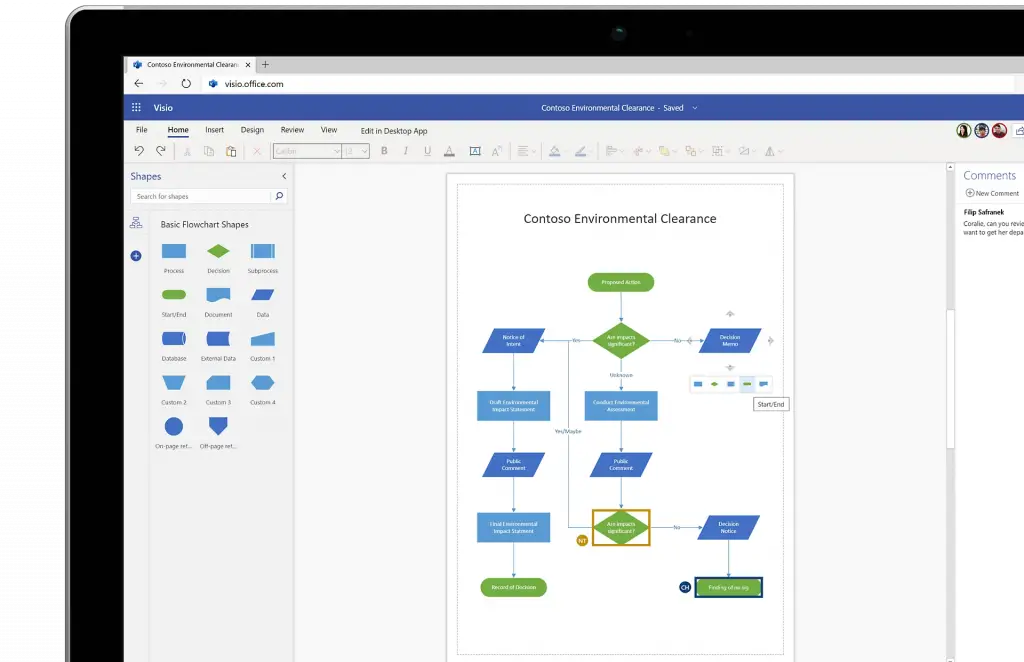
In the realm of complex diagrams and flowcharts, Microsoft Visio stands tall. Its myriad of features and templates allow you to craft detailed illustrations for your academic papers with relative ease.
What are the benefits of Microsoft Visio?
- Precise diagrams: Offers the ability to create complex, highly detailed diagrams.
- Extensive libraries: Includes vast libraries of shapes, icons, and templates.
- Integration: Seamless integration with other Microsoft Office apps for smooth workflow.
For comprehensive and intricate diagramming, few tools can match the robust capabilities of Microsoft Visio.
How much does it cost?
- Plan 1: $5 per month paid yearly
- Plan 2: $18 per month paid yearly
Source: https://www.microsoft.com
#3. Lucidchart: Best for Collaborative Diagramming
Summary
- Streamlined, web-based diagramming tool
- Real-time collaboration capabilities
- Suitable for creating a broad array of charts and diagrams
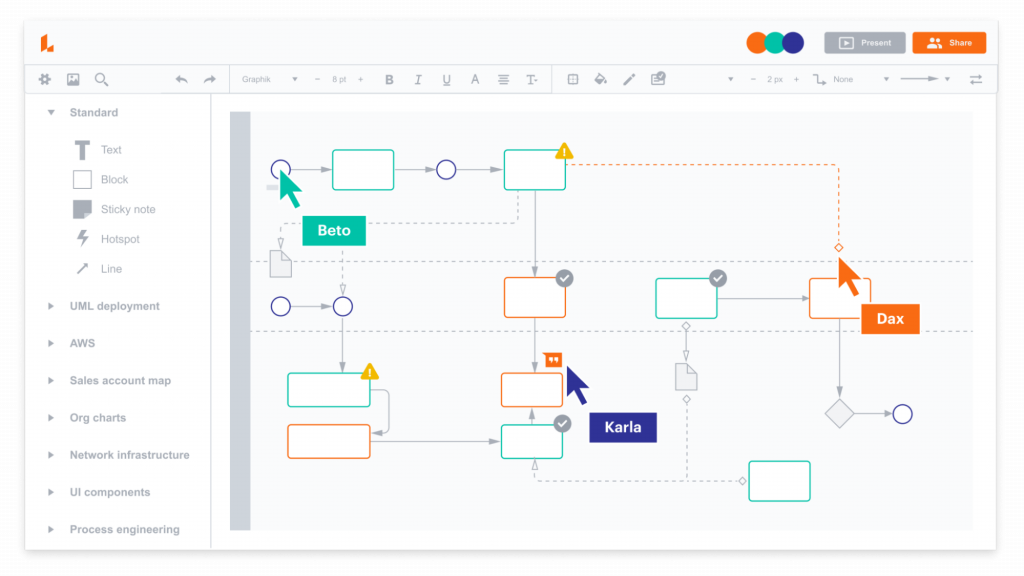
Lucidchart is a cloud-based oasis for academics who crave real-time collaboration. It allows multiple users to work on diagrams simultaneously, a much-needed feature in group research projects.
What are the benefits of Lucidchart?
- Real-time collaboration: Team up with others, no matter where they are.
- Variety of templates: Lucidchart’s vast array of templates makes diagramming a breeze.
- Cloud-based: Access your work from anywhere, anytime.
If collaborative diagramming is on your agenda, Lucidchart could be your digital meeting room.
How much does it cost?
- Free
- Individual: $119.40 per year
- Team: $108 per year for one person
- Enterprise: $219 per year for one person
Source: https://www.lucidchart.com
#4. Sketchboard: Best for Quick Concept Sketches
Summary
- Lightweight, fast, and intuitive platform
- Designed for quick conceptual sketching
- Supports team collaboration and sharing
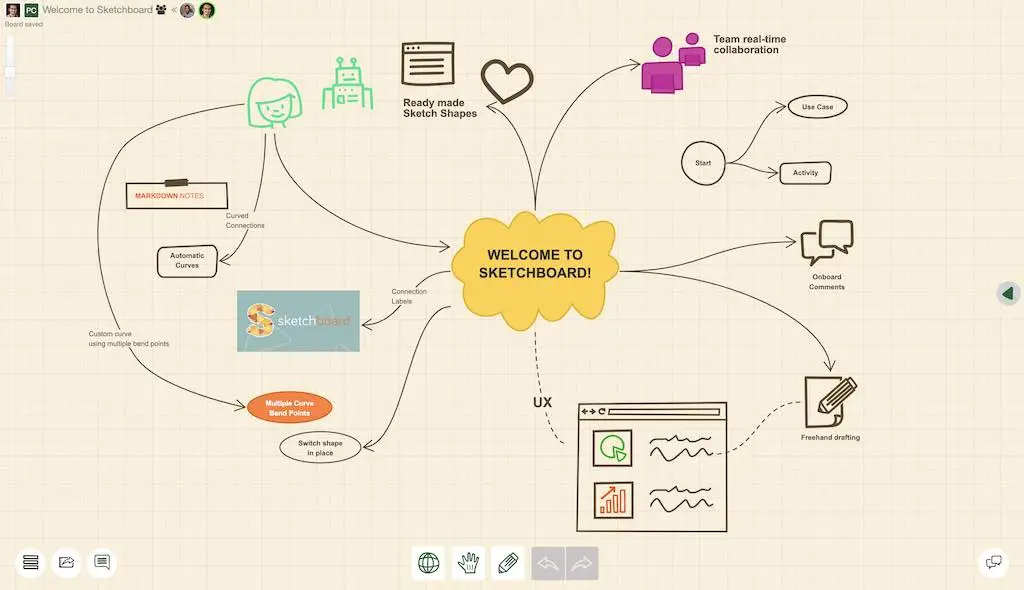
Sketchboard enters the scene like a breath of fresh air, transforming the chaos of brainstorming into neat and tidy sketches.
Its nimble functionality makes it the perfect tool for quickly jotting down fleeting ideas or mapping out mind-boggling concepts for your research paper.
What are the benefits of Sketchboad?
- Speedy sketches: The fast interface is ideal for quickly capturing ideas.
- Collaboration: Join forces with team members to refine your concepts.
- Simplicity: Its minimalistic design keeps you focused on what truly matters: your ideas.
When time is of the essence, and ideas are pouring in thick and fast, Sketchboard can serve as your digital sketchpad. It turns abstract thoughts into comprehensible visuals swiftly and efficiently.
How much does it cost?
- Solo: $8 per month for one person paid yearly
- Team: $7 per month for person (paid annually)
- Business: $9 per month for one person (paid annually)
Source: https://sketchboard.io
#5. Vectr: Best for Basic Vector Graphics
Summary
- Free and easy to use
- Generates scalable vector graphics
- Real-time collaboration and sharing options
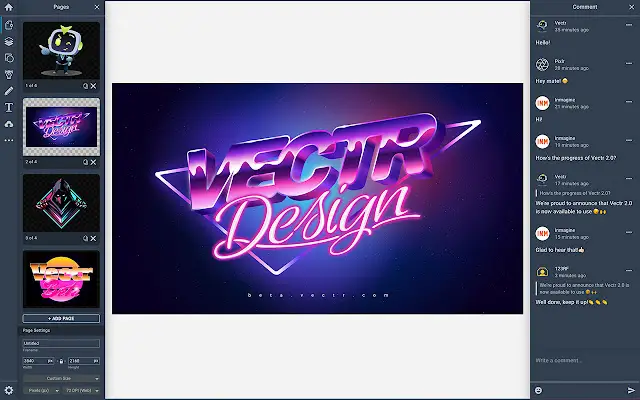
Vectr is a beacon of hope for those looking for a straightforward tool to create basic vector graphics. With its intuitive interface and accessible functionalities, this free drawing software simplifies the process of creating visually striking diagrams for your thesis.
What are the benefits of Vectr?
- Economical: Its zero cost makes it a great pick for budget-conscious scholars.
- User-friendly: No advanced design skills? No problem. Vectr’s got your back.
- Real-time sharing: Collaborate and share your designs in real-time with your peers.
If your thesis requires simple yet impactful vector graphics and your budget is tight, Vectr could be your knight in shining armor, enabling you to create and share remarkable graphics without breaking the bank.
How much does it cost?
- Free
Source: https://vectr.com
#6. Creately: Best for Versatile Diagramming Needs
Summary
- Offers an extensive library of diagram types and templates
- Supports real-time collaboration
- Allows exporting in various formats
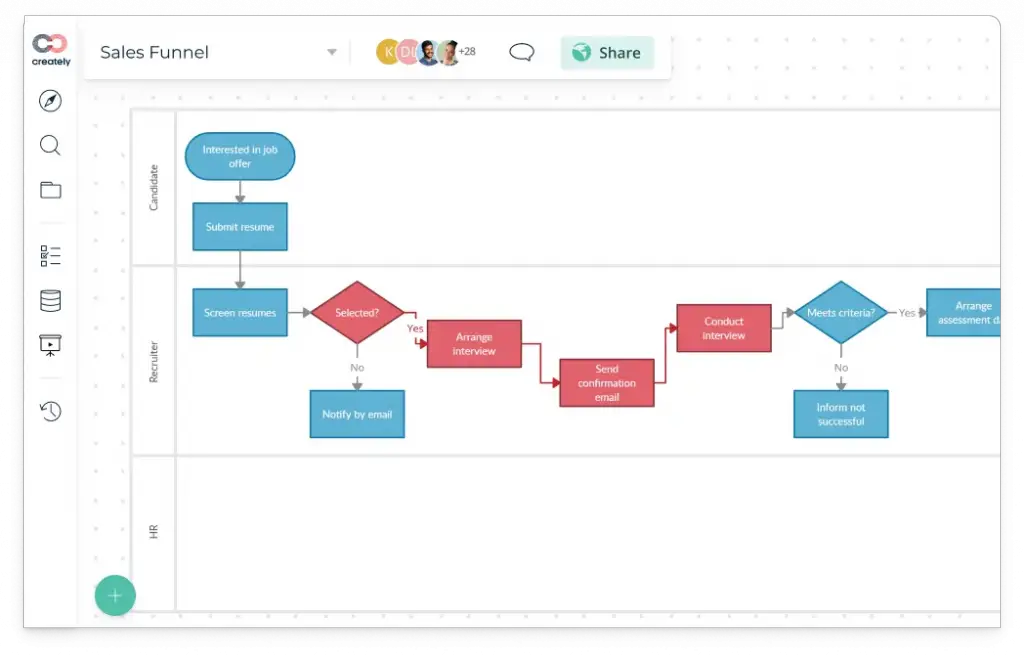
Creately is like a box of magic tricks, brimming with a wide array of diagramming options to fit your academic needs. Its versatile nature enables you to produce various diagrams, flowcharts, and mind maps that can bring your research to life.
What are the benefits of Creately?
- Diverse options: An extensive array of diagram types to suit your specific needs.
- Real-time collaboration: Team up with peers and draw scientific diagrams easily.
- Multiple export options: Easily export your diagrams in your preferred format.
Creately’s broad set of features and diagram types could be the tool you’re looking for, helping you visually communicate your research in a more comprehensive manner.
How much does it cost?
- Free
- Starter: $5 per month
- Business: $89 per month
Source: https://creately.com
#7. Draw.io (diagrams.net): Best for Simple and Quick Diagramming
Summary
- User-friendly interface with drag-and-drop features
- Offers a wide range of shapes and templates
- Allows for easy sharing and collaboration
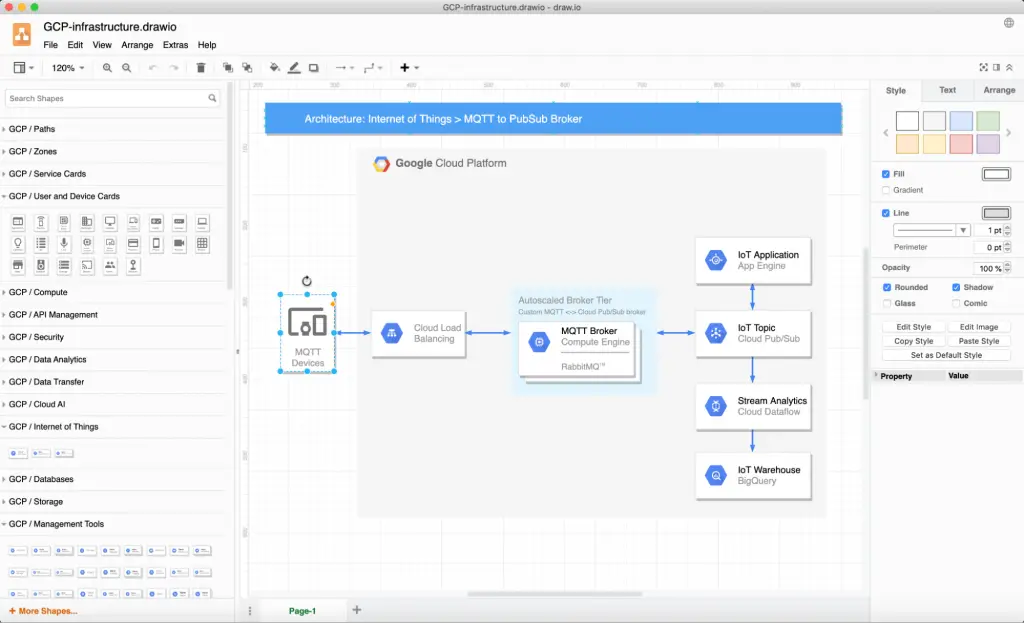
Draw.io, known for its uncomplicated, swift diagramming, is a lifesaver for those urgent, last-minute illustrative needs in your thesis.
This free online drawing software has a straightforward approach and easy-to-use interface making it a cinch for anyone to quickly create diagrams, even under the gun.
What are the benefits of Draw.io?
- Simplicity: Navigating this tool is a walk in the park, even for first-timers.
- Speed: If you need to draft a diagram swiftly, Draw.io is your tool.
- Collaboration: Sharing your diagrams with peers has never been easier.
When you’re racing against the clock and require a diagramming tool that’s quick on the draw and easy to manage, Draw.io comes to your rescue.
Its simplicity and speed can turn the tide in your favor, allowing you to stay focused on your research instead of struggling with complicated diagramming software.
How much does it cost?
- Free
Source: https://app.diagrams.net
#8. Cacoo: Best for Real-Time Collaborative Editing
Summary
- Features an intuitive and easy-to-use editor
- Offers real-time collaborative editing
- Provides a variety of templates and shapes
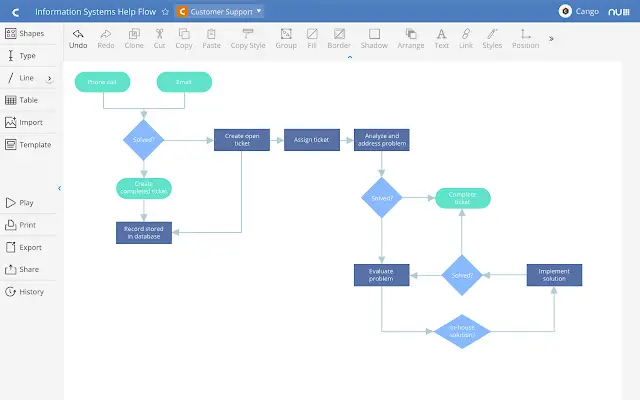
With its shared workspace and real-time updates, Cacoo becomes the perfect match for those brainstorming sessions with your team. It adds that interactive spark to your thesis creation process.
What are the benefits of Cacoo?
- Teamwork: Real-time collaboration makes team brainstorming sessions a breeze.
- User-friendly: Its easy-to-use editor ensures a smooth diagramming experience.
- Variety: A wide range of templates and shapes helps you illustrate your ideas accurately.
Cacoo’s ability to bring teams together on a shared platform to brainstorm, discuss, and modify diagrams in real time can add a dynamic touch to your academic journey.
How much does it cost?
- Free
- Pro: $6 per month
Source: https://nulab.com
#9. Gliffy: Best for Creating and Sharing Flowcharts and Network Diagrams
Summary
- Powerful tool for creating high-quality flowcharts and network diagrams
- Provides a wide range of shapes and templates
- Allows for easy collaboration and sharing
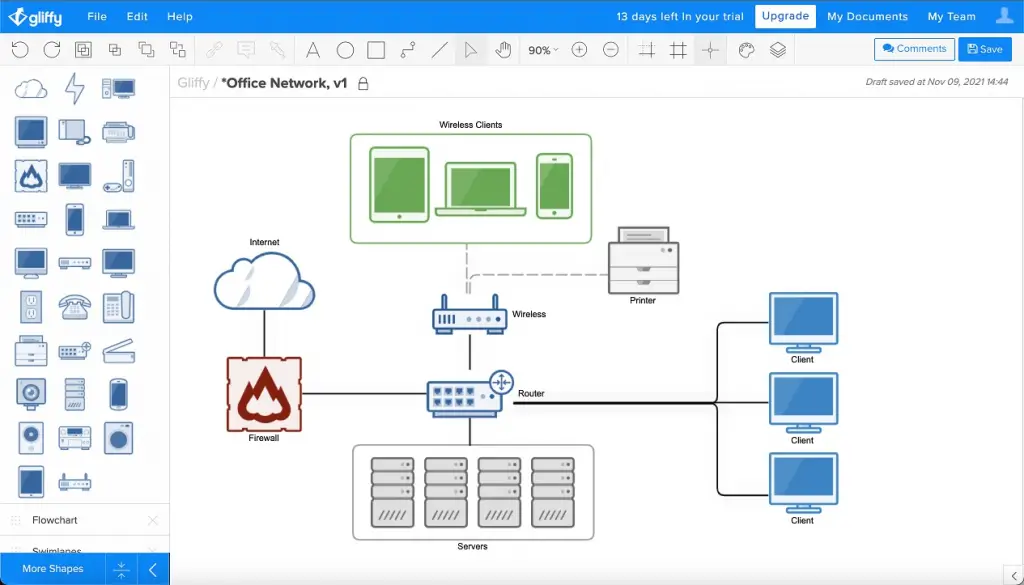
With a knack for creating stellar flowcharts and network diagrams, Gliffy shines as a potent tool in your academic arsenal. Its vast selection of templates and shapes simplifies the process of translating your complex ideas into lucid, engaging visuals.
What are the benefits of Gliffy?
- Quality diagrams: Produce professional-looking flowcharts and network diagrams.
- Extensive library: A plethora of shapes and templates at your disposal.
- Collaboration: Easily share your diagrams and collaborate with peers.
If your thesis leans heavily on flowcharts or network diagrams, Gliffy could be your best bet.
With its wide range of resources and straightforward interface, this free software can streamline the creation of high-quality diagrams, allowing you to articulate your complex ideas with clarity and precision.
How much does it cost?
- Professional: $6/$8 per month paid yearly
- Enterprise: Custom price
Source: https://www.gliffy.com
#10. SmartDraw: Best for Detailed Diagrams
Summary
- Offers a comprehensive toolset for creating detailed diagrams
- Provides thousands of templates and symbols
- Integrates well with other tools
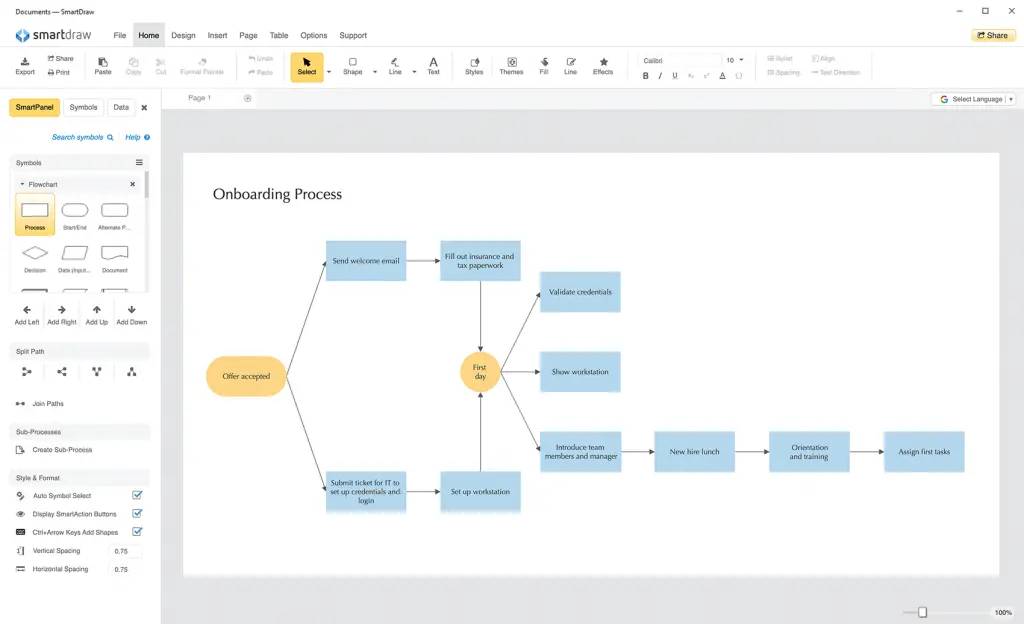
SmartDraw brings to the table a comprehensive set of tools that can turn your complex data into clear and meaningful visuals. Its wide-ranging capabilities make it an excellent partner for producing detailed diagrams for your academic papers.
What are the benefits of SmartDraw?
- Detail-oriented: SmartDraw excels in creating intricate, detailed diagrams.
- Extensive resources: A vast library of templates and symbols at your fingertips.
- Integration: Seamlessly integrates with other platforms for efficient workflows.
SmartDraw empowers you to craft compelling visuals that enrich your academic work and present your findings in a clear, understandable manner.
How much does it cost?
- Enterprise: about $1 for one user per month paid yearly
- Team: starts at $5.95 per user (paid yearly)
- Individual: $9.95 per month paid yearly
Source: https://www.smartdraw.com
#11. Adobe Illustrator: Best for Professional Vector Illustrations
Summary
- High-end tool for creating professional vector graphics
- Offers advanced features for detailed illustrations
- Supports a wide variety of file formats
Adobe Illustrator, the heavyweight champion in the arena of vector illustrations, needs little introduction.
For those seeking professional-grade visuals, Illustrator’s advanced features and capabilities enable you to create intricate, high-quality graphics that can elevate the visual appeal of your thesis.
What are the benefits of Adobe Illustrator?
- Professional quality: Generates top-tier vector illustrations for impactful visuals.
- Advanced features: A comprehensive set of tools for creating detailed designs.
- File format support: Supports numerous file formats, offering you flexibility.
While it may require a steeper learning curve, the investment of time can yield rich dividends in the form of stunning visuals that add a touch of professionalism to your academic work.
How much does it cost?
- $31.49 per month
Source: https://www.adobe.com
#12. Google Drawings: Best for Simple, Web-Based Diagramming
Summary
- Free and simple web-based tool
- Ideal for creating basic diagrams and charts
- Facilitates easy sharing and collaboration
Google Drawings, a cloud-based tool that specializes in simple diagramming, brings Google’s trademark ease-of-use to the world of academic illustrations.
If you’re after a free, straightforward tool that seamlessly integrates with other Google services, Google Drawings fits the bill.
What are the benefits of Google Drawings?
- Simple to use: The interface is intuitive, making diagramming easy.
- Web-based: Access your diagrams from anywhere, at any time.
- Collaboration: Share and collaborate on your diagrams effortlessly.
Google Drawings’ might be your best ally. Its simplicity and accessibility make it a viable choice for those who value ease-of-use and cloud-based accessibility in their academic journey.
How much does it cost?
- Free
Source: https://en.wikipedia.org
#13. Inkscape: Best for Open-Source Vector Graphics Editing
Summary
- Powerful, open-source software for vector graphics editing
- Offers a broad range of advanced tools and features
- Supports multiple file formats
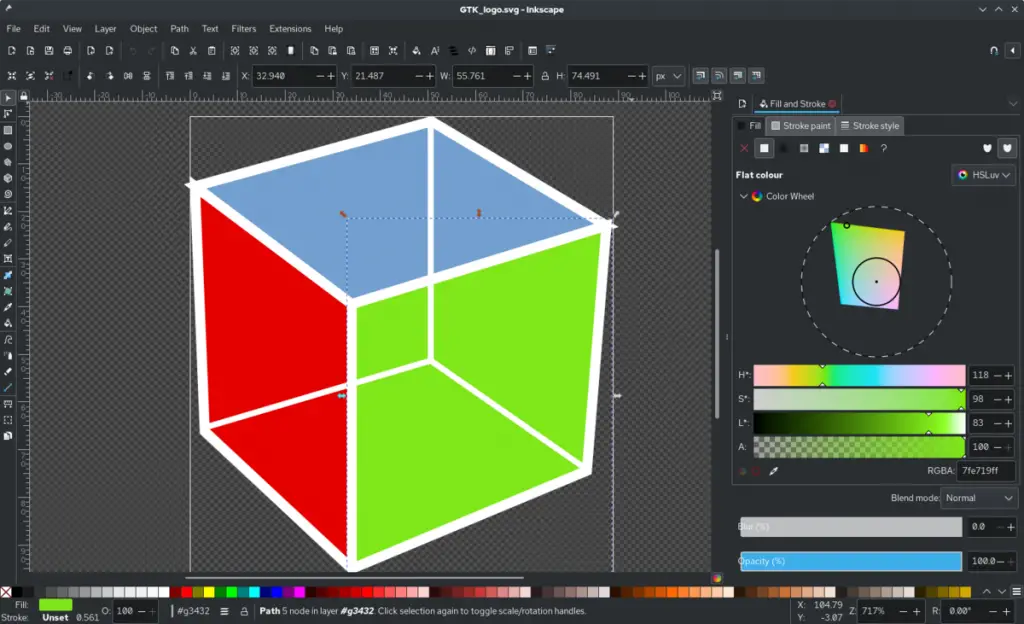
Inkscape, an open-source darling, offers a powerful platform for creating and editing vector graphics.
If you’re a researcher who believes in the power of community-driven software and needs to create detailed, scalable visuals, Inkscape could be your ticket to success.
What are the benefits of Inkscape?
- Open-source: The power of community-driven development at your fingertips.
- Advanced toolset: A myriad of features for detailed vector graphics editing.
- File format flexibility: Accommodates numerous file formats for convenience.
Inkscape provides a powerful platform for your academic illustrative needs. It open-source nature also fosters a spirit of collaboration and community that can enrich your academic journey.
How much does it cost?
- Free
Source: https://inkscape.org
#14. Gravit Designer (now Corel Vector): Best for Comprehensive Vector Design Across Platforms
Summary
- Versatile tool for vector designing
- Operates smoothly across different platforms
- Offers an intuitive interface with a variety of features
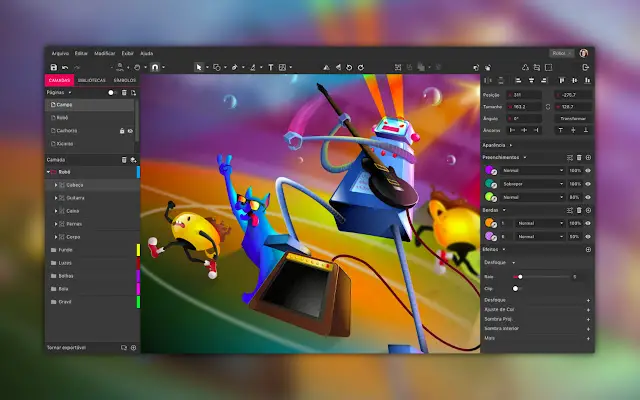
Gravit Designer marks its territory as a comprehensive solution for vector designing across different platforms. Its versatility, coupled with an array of features, makes it an ideal choice for those needing high-quality vector illustrations for their academic work.
What are the benefits of Gravit Designer?
- Versatility: Works seamlessly across various platforms.
- Comprehensive: Packed with a rich set of features for detailed vector designing.
- Intuitive: Its user-friendly interface facilitates a smooth designing process.
If your research calls for high-quality vector designs and you require a tool that can adapt to different platforms, Gravit Designer could be your reliable companion.
Its blend of versatility, comprehensiveness, and ease of use can help you create top-notch visuals that add depth to your academic research.
How much does it cost?
- Free
- Pro: Starts from $48.79
Source: https://cloud.gravit.io
#15. Venngage: Best for Professional Infographics and Reports
Summary
- Specializes in creating professional infographics and reports
- Provides numerous templates and customization options
- Enables sharing and collaboration
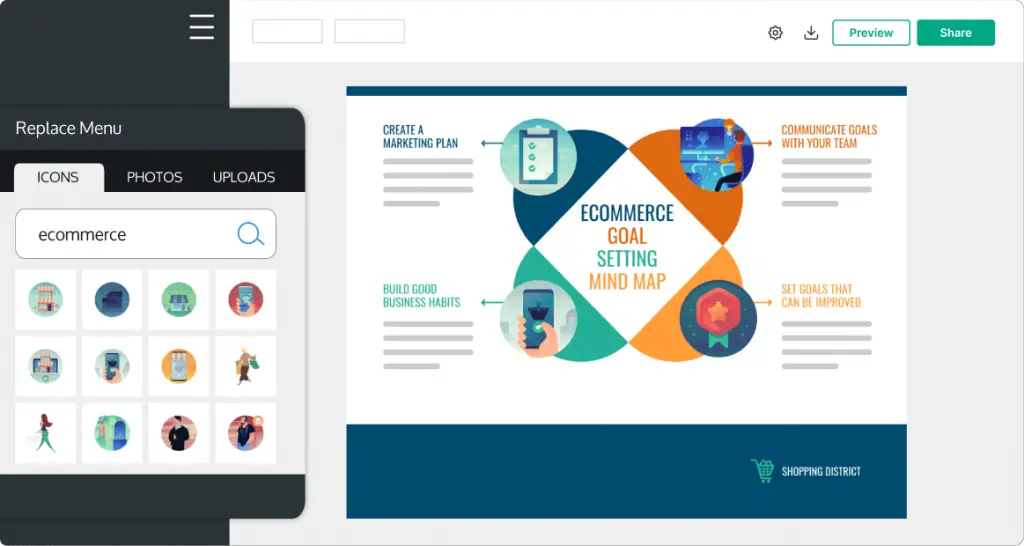
Venngage stands tall as a specialist in crafting professional infographics and reports. If your thesis or research paper calls for data visualization that tells a story or a report that catches eyes, Venngage’s broad library of templates and design options can make it a reality.
What are the benefits of Venngage?
- Specialization: Excel in creating impactful infographics and engaging reports.
- Customization: A wealth of templates and design options to make your work unique.
- Sharing and Collaboration: Easily collaborate with peers and share your designs.
If your academic work demands professional infographics and visually engaging reports, Venngage could be your secret weapon. Its specialization in these areas can help you tell your research story more effectively and engage your readers in a compelling visual journey.
How much does it cost?
- Free: 0$
- Premium: $10 per month paid yearly
- Business: $24 per month paid yearly
- Enterprise: Starts at $499 per month paid yearly
Source: https://venngage.com
Conclusion
These famous online drawing tools can serve as your allies in the academic battlefield.
Whether it’s the open-source capabilities of Inkscape, the comprehensive design platform of Gravit Designer, or Venngage’s knack for professional infographics and reports, there’s a tool out there that can cater to your specific needs.
In the end, remember that the ultimate goal is to effectively communicate your research. Choose the tool that helps you do that in the best way possible, and you’re already on the path to success.


